A look at the information provided following your cutting list optimization, including your cutting maps, cuttings sequences, a technical overview of the results and costings.
In the last videos we showed how to set up the cutting lists to produce your cutting maps.
In this video we’ll examine the information that OptiCut produces, and see how we can use the cutting maps and sequences that are created.
Click on the Cutting List icon to see a cutting list that has already been loaded into OptiCut. Click OK to close it again.
Click on the Optimize button to optimize this cutting list. OptiCut now shows a screen that is divided into 4 sections.
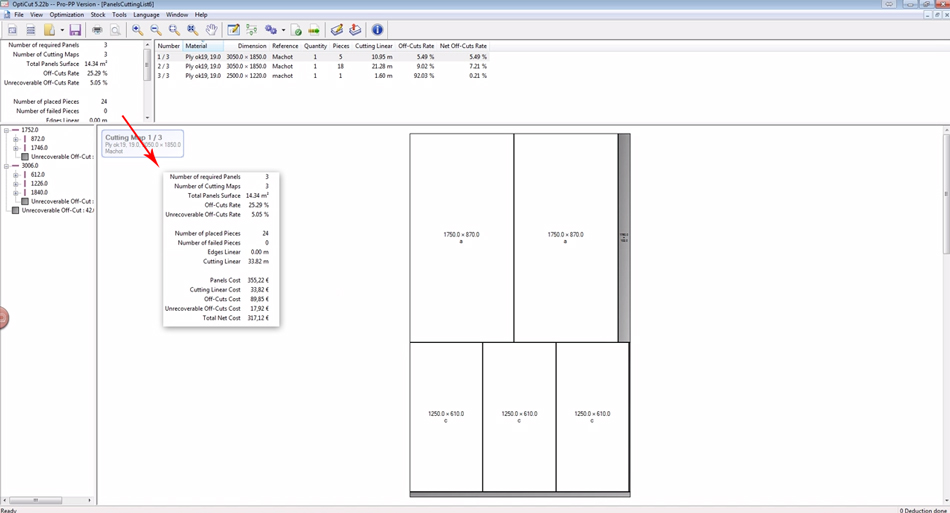
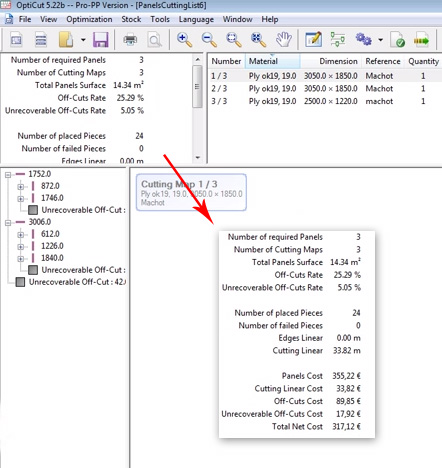
Top left shows general information relating to the optimization:
Required number of panels
Number of cutting maps
Total panel surface
Off cut rate
Unrecoverable off cut rate or off cuts that are too small to be reused
The off cut minimum reuse size can be set up to your requirements. We also have:
Number of placed pieces or parts
Number of failed pieces or parts that could not be fitted onto any panel for cutting
Edges linear or the total length of the edging
Cutting linear or the total length of the cutting
Then we have cost information according to the pricing we’ve already set up:
Panels cost
Cutting linear cost
Off cuts cost
Unrecoverable off cuts cost or cost of the waste
Total net cost
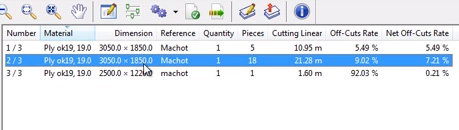
Next to that window on the right is the list of panels with information specific to that panel.
OptiCut in this case has optimized the cutting list onto 3 panels, but of 2 different sizes. One size is 3050mm x 1850mm.
The other is 2500mm x 1220mm. We had both sizes in stock and OptiCut has determined that this is the best combination to use.
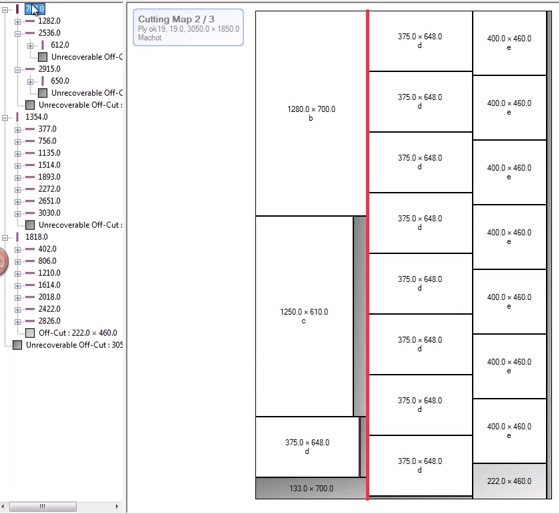
In the main window we have the graphic cutting map. Click through the panels in the window above to see the cutting map for each.
The window bottom left shows the hierarchical cutting sequence for each sheet.
The first level shows the 3 first cuts to make.
Underneath each of those cuts we have the cuts to be made on each of the newly cut panels that result from the first set of 3 cuts.
This hierarchy continues down to the third set of cuts and so on.
As you select each cut in the window on the left, you see that exact cut highlighted on the cutting map and therefore the sequence as well.
Please see here for further details on our Sheet Cutting Optimization Software.