Nesting patterns and optimization report
The results of an optimization are shown on screen immediately.
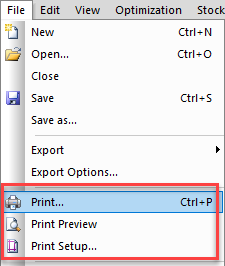
They are also available for printing via the File menu > Print.
The different elements are described below.
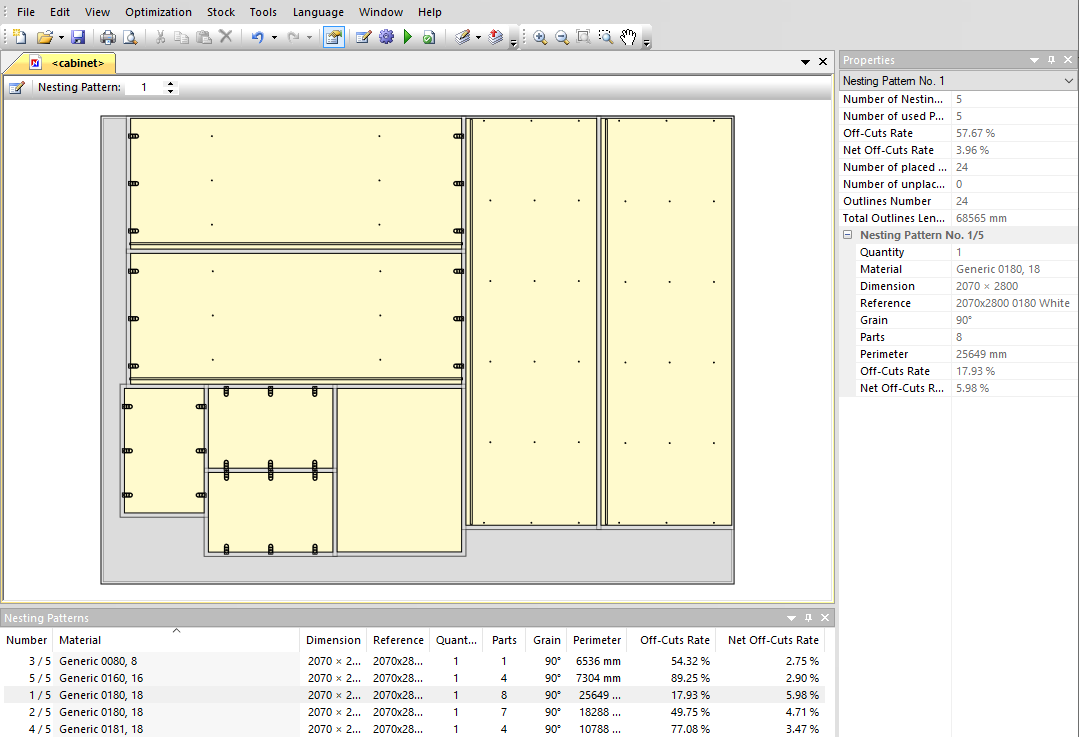
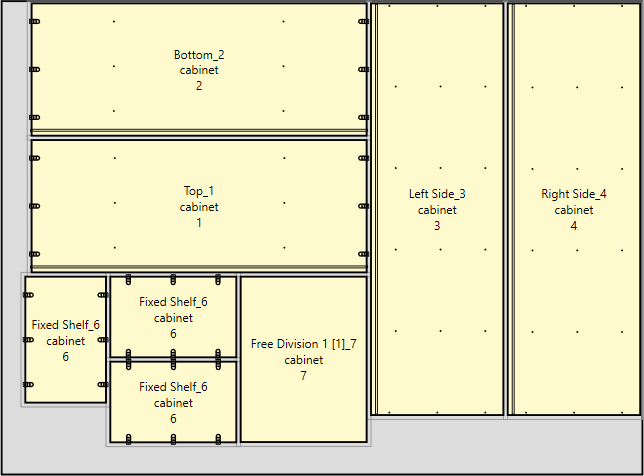
Nesting patterns
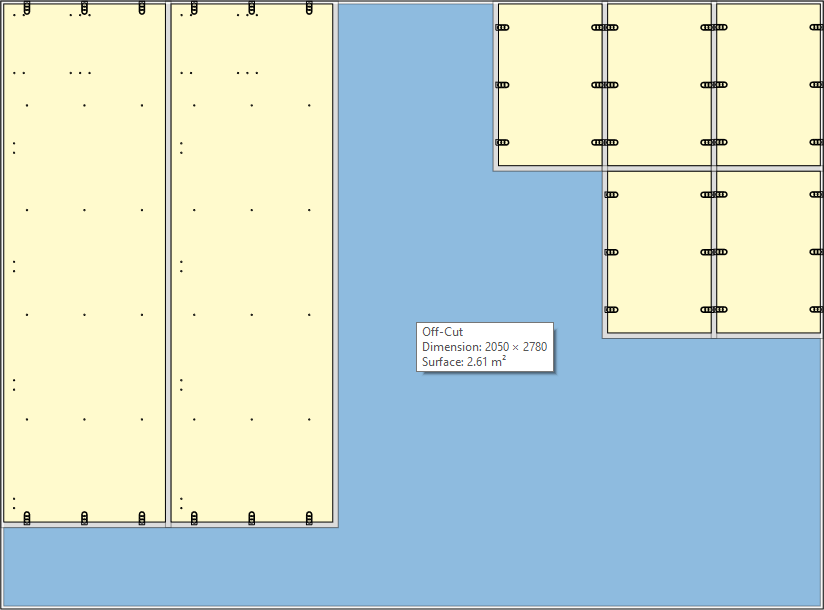
This is a visual representation of the nested parts on each panel.
Hover over a part for additional information.
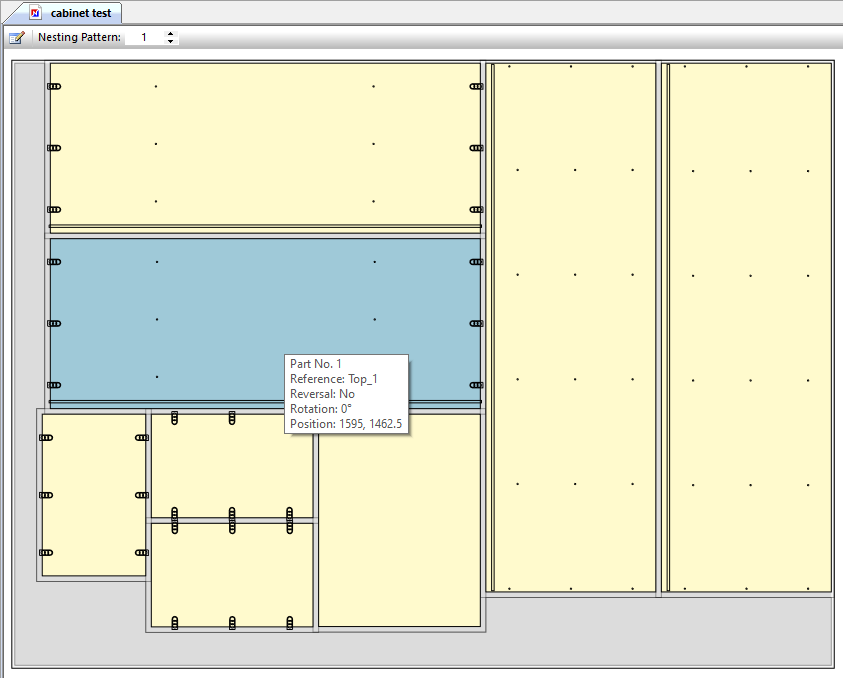
Hover outside a part for details of the off-cut.
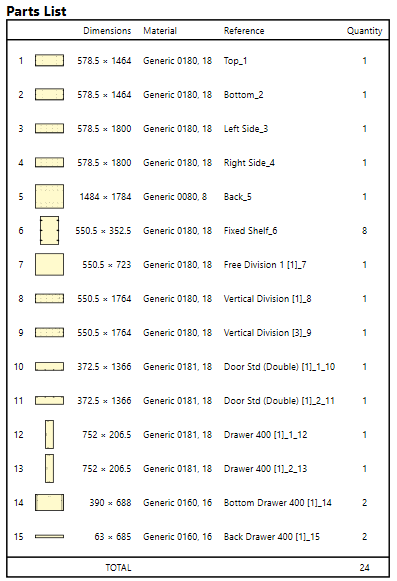
Click on the Parts list icon to return to the parts list, or use the up and down arrows to scroll through each nesting pattern in turn.
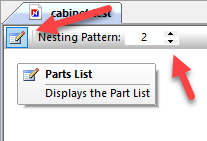
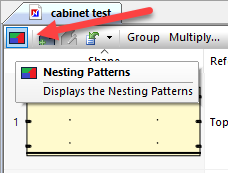
The parts list has its own icon to return to the nesting patterns once they’ve been generated.
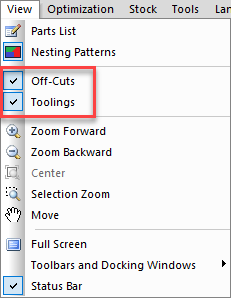
Visibility of the tooling/machining details and off-cut details can be set in the View menu.
The View menu includes additional settings to zoom, centre and move the nesting pattern. The scroll wheel on a mouse will zoom, hold down the scroll wheel to move the pattern.
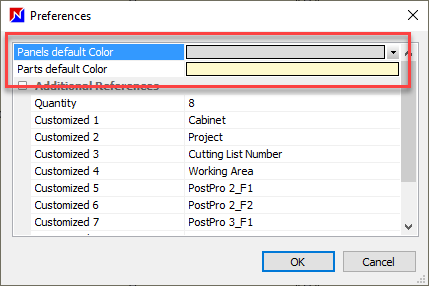
Go to Tools > Preferences to modify the part and panel colours.
Properties window
This provides details of the overall optimization results and below that the results just for the selected nesting pattern.
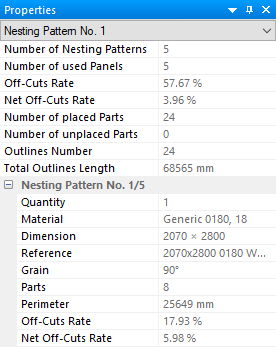
Key metrics include the number of unplaced parts, and the off-cuts rate and s shown in two ways:
- The off-cuts rate is the off-cut remaining as a % of the panel
- The net off-cuts rate is the removed material due to the cutting tool thickness and any panel trim cut, as a % of the panel
Optimization report
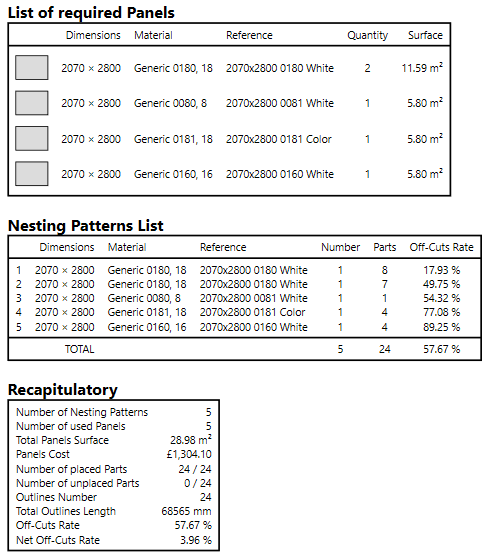
A more detailed optimization report, which also includes an image of each pattern, is available in printed format. An example is shown below:
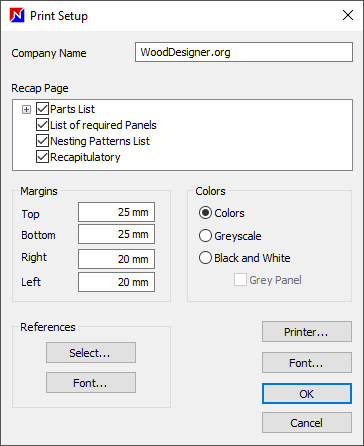
To configure this printed report, including which report elements to include, go to File menu > Print setup.
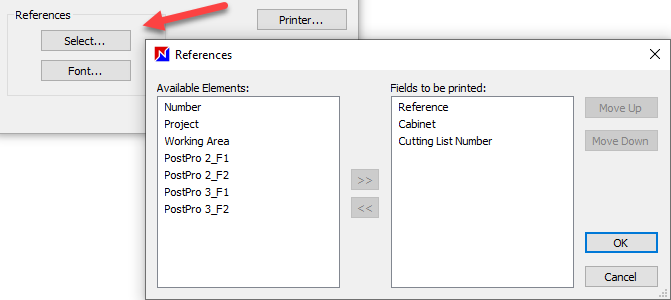
To display/hide information on the parts shown on the nesting patterns, go to References > Select and choose the fields to display and their position in the usual way:
Material and cost report
This recapitulatory shown in the printed report above provides similar information to the Properties window i.e. a breakdown of the optimization results.
Adjust the optimization parameters as required, re-optimize and compare the results.
Optimization result
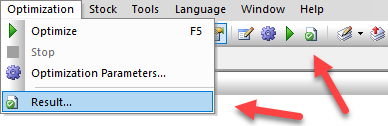
A further on screen display of the optimization is available.
Go to Optimization > Result or click on the Result icon in the toolbar:
This is the resulting window, providing access to the material and cost report, and to the list of panels used:
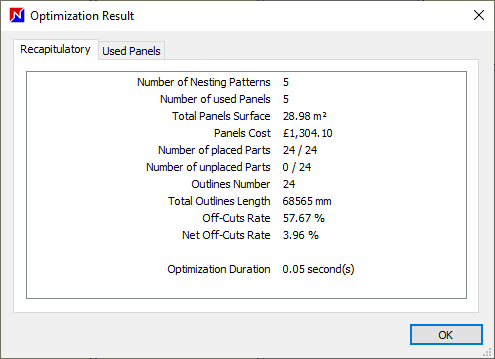
This result data can be output as a csv file.
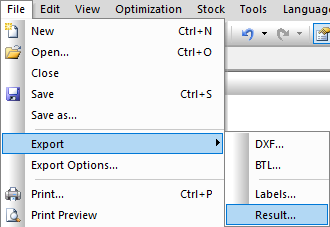
Go to File menu > Export > Result.